 |
|
|

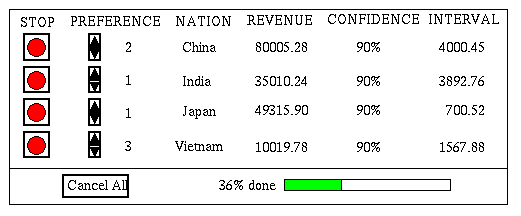
select nation, sum(revenue) from Sales; Consider the following scenario: An analyst wants to know how well a company did last year in different countries. In the figure, the aggregate revenue is computed on the input, grouped by the Nation attribute. In traditional data processing, he has to enter a SQL query and wait for a long time (sometimes hours!) to get the result. Whereas in the online aggregation interface shown in the figure, a running statistical estimate (with a confidence interval) of the revenue earned in each nation is given. A significant advantage of giving intermediate results is that the user can guide the processing. In the example shown, the analyst can quickly see that the company is doing really badly in Vietnam and really well in China. He would then be more interested in the results for these countries than for the others. Rather than wait for hours to get complete, ten-decimal-point results for all countries, he will probably want to quickly get reasonably accurate values for Vietnam and China since these are the results he is really bothered about. Ideally, he wants a way to tell the system to process more items (here an item could be a record containing information about a transaction such as price, date, and quantity) corresponding to Vietnam and China, at the expense of others. Here is where Online Permutation comes in. The user can indicate his interest by increasing the preference for Vietnam and China, as shown in the figure, to 2 and 3, so that the system will start processing more items corresponding to these two countries. Once he gets a reasonable answer for these two countries quickly, he could "drill down" to analyse other factors prevailing there. In general, the user can "speed up" and "slow down" the rates at which aggregates for different groups are being computed, based on his interest. |